Oregon Teen Driver Crash Statistics: The Gold Standard for Driver Education Effectiveness Crash Reduction
Research shows that effective driver education crash reduction significantly decreases the likelihood of accidents among teen drivers.
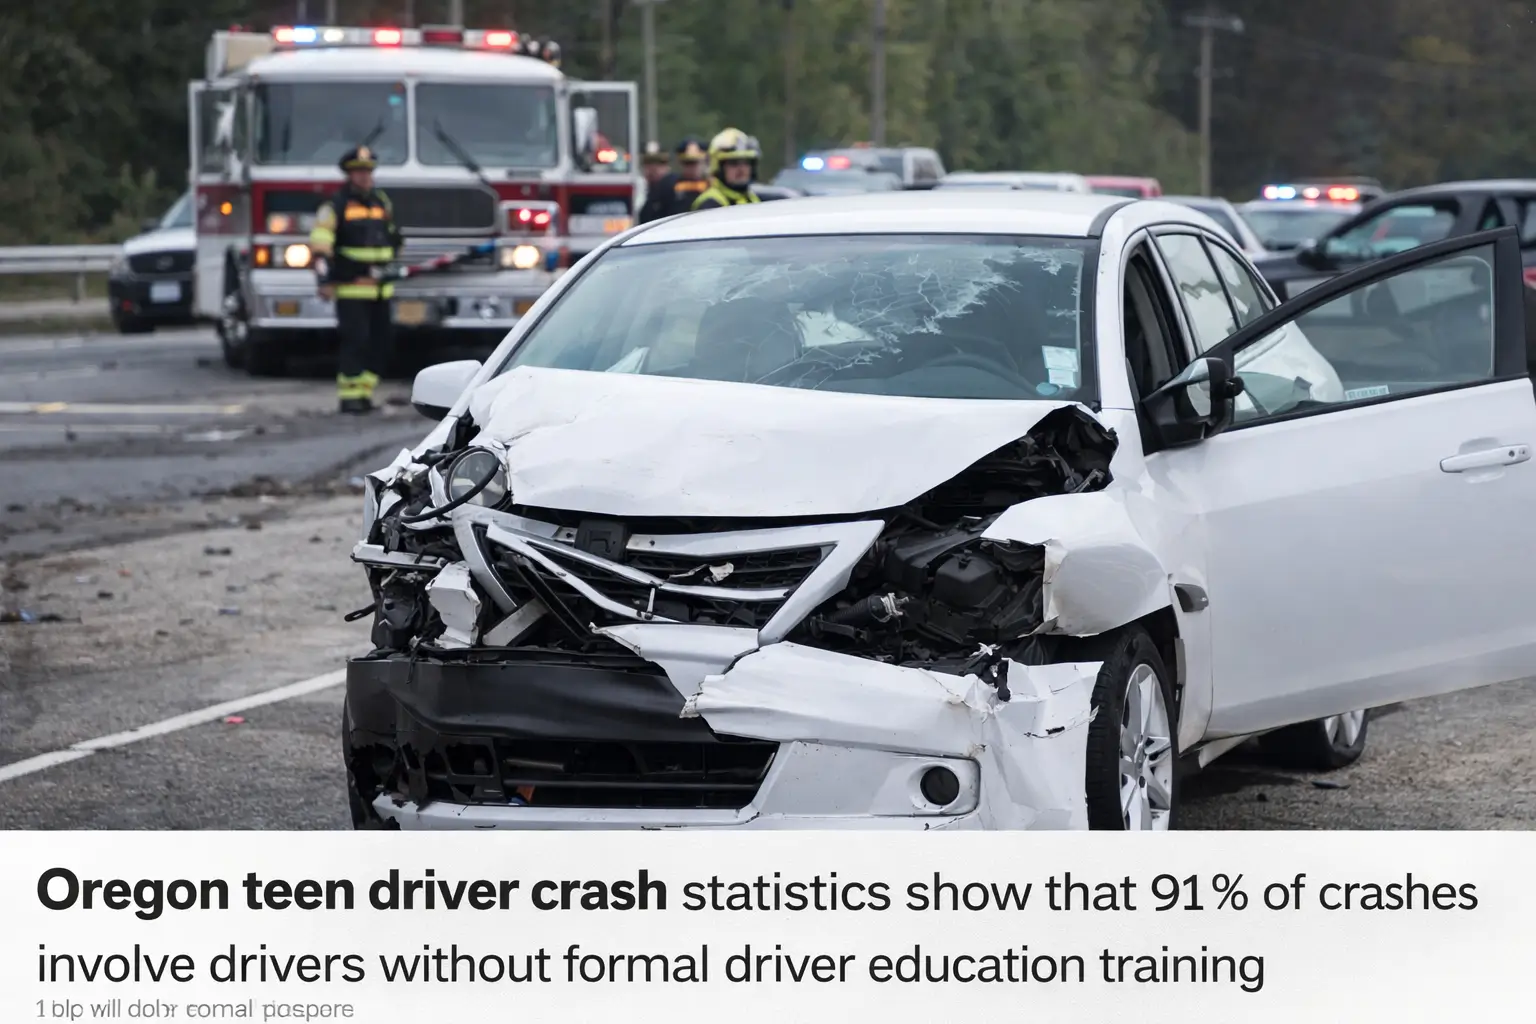
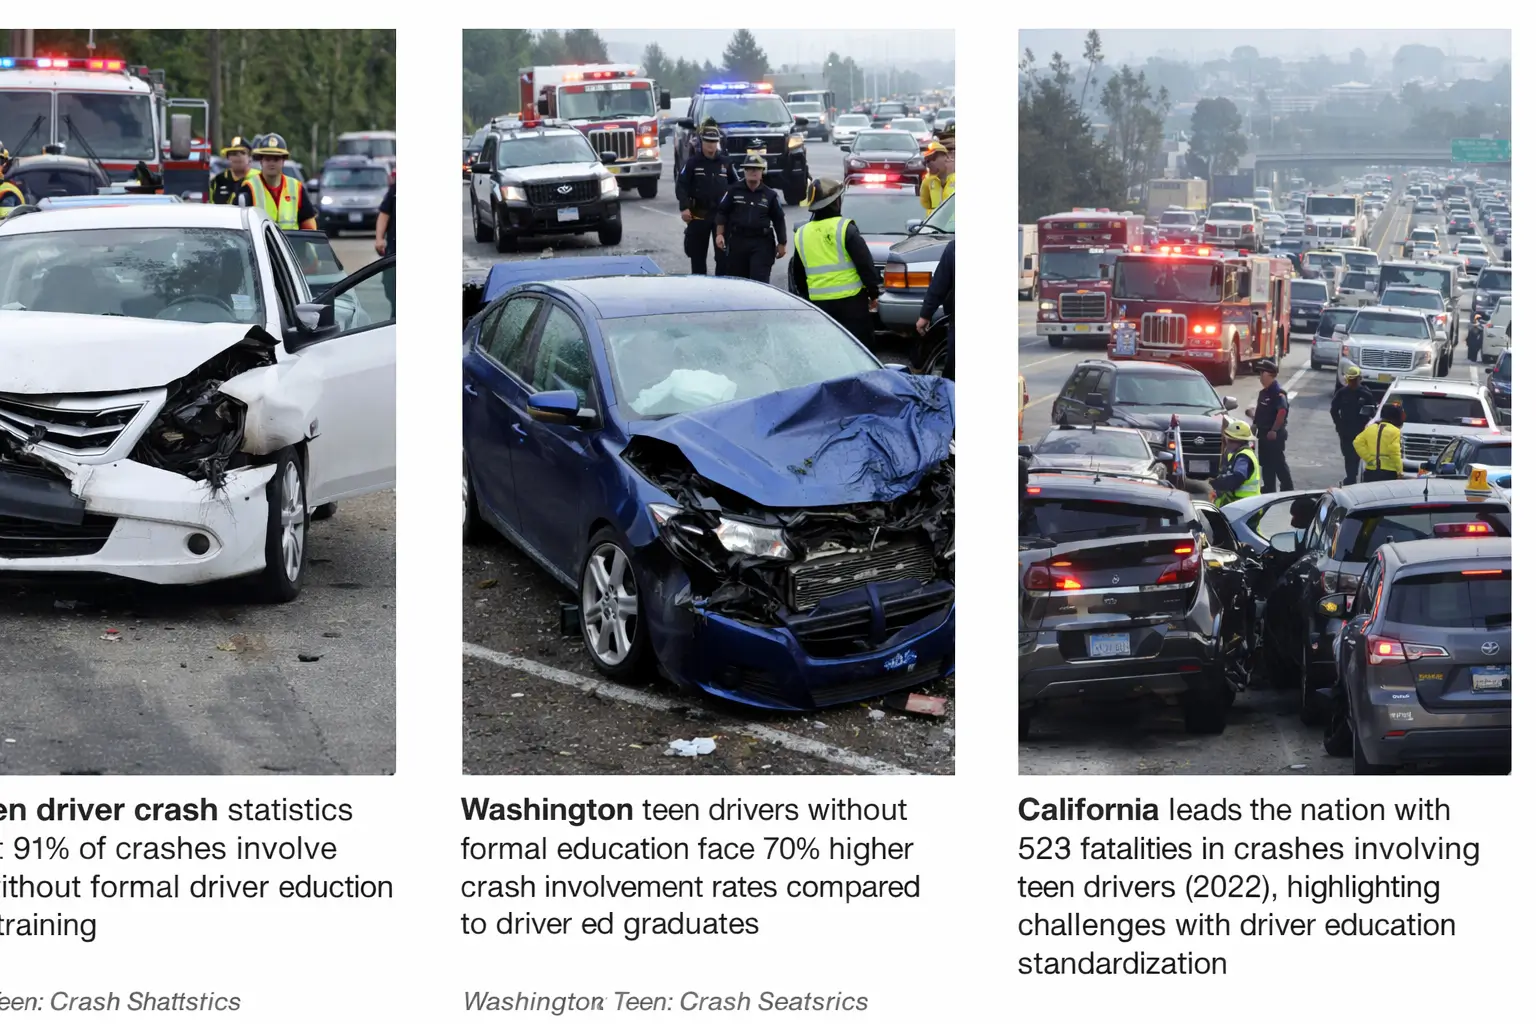
The Stunning 91/9 Split: Oregon’s Most Powerful Safety Statistic
The 2018 ODOT 4-year study revealed Oregon’s most compelling finding: 91% of crashes involving teen drivers ages 15-20 occurred among teens who had NOT completed driver education. This means that teens who completed ODOT-approved programs accounted for only 9% of teen crashes, despite representing approximately one-third to one-half of all eligible teens in Oregon.
Quantifiable Safety Benefits for Oregon Teen Drivers
- 21% lower crash rate for teens completing ODOT-approved programs
- 57% lower traffic conviction rate compared to non-driver ed teens
- Up to 15% annual insurance discount for families
- Waived DMV drive test upon program completion
- Only 50 hours supervised practice required (vs. 100 hours without driver ed)
Fatal Crash Statistics: The Life-or-Death Impact
Oregon’s data becomes even more striking when examining fatal crashes:
- 2012-2016: 52 teen drivers ages 15-17 involved in fatal crashes, resulting in 56 deaths and hundreds of serious injuries
- 2017 preliminary data: 51 people killed by 44 drivers ages 15-20
- Based on the 91% statistic: 40-41 of those 44 fatal crash drivers had NOT taken driver education
- Only 3-4 had completed ODOT-approved programs
What Makes Oregon’s ODOT-TSO Approved Programs Different
Oregon’s superior results stem from rigorous standardization:
Structured Curriculum Requirements:
- 30 hours classroom instruction
- 6 hours behind-the-wheel instruction
- 6 hours practice driving observation
- 5 hours supervised practice
- Oregon Risk Prevention Curriculum (Playbook R3) – nationally recognized
Instructor Qualifications:
- Rigorous 120-hour certification program
- First Aid and CPR certified
- 15 hours continuing education credits every two years
- Must teach minimum 30 hours in ODOT-TSO approved program every two years
- Clean driving record requirements with strict violation limits
Vehicle Standards:
- Instructor brake system
- Additional rear-view and eye-check mirrors
- Clear “Student Driver” or “Driver Education Car” signage
Oregon’s GDL Integration: A Comprehensive Safety System
Oregon’s Graduated Driver Licensing (GDL) program works synergistically with formal training:
- First 6 months: No passengers under 20 except immediate family
- Second 6 months: Maximum 3 passengers under 20 (non-family)
- First year: No driving midnight-5 AM (with limited exceptions)
- Phone ban: Zero tolerance for drivers under 18
Research shows Oregon’s GDL program contributes to a 7-8% sustained reduction in teen crash injuries, with night-time restrictions showing 23-25% lower crash injury and fatality rates.
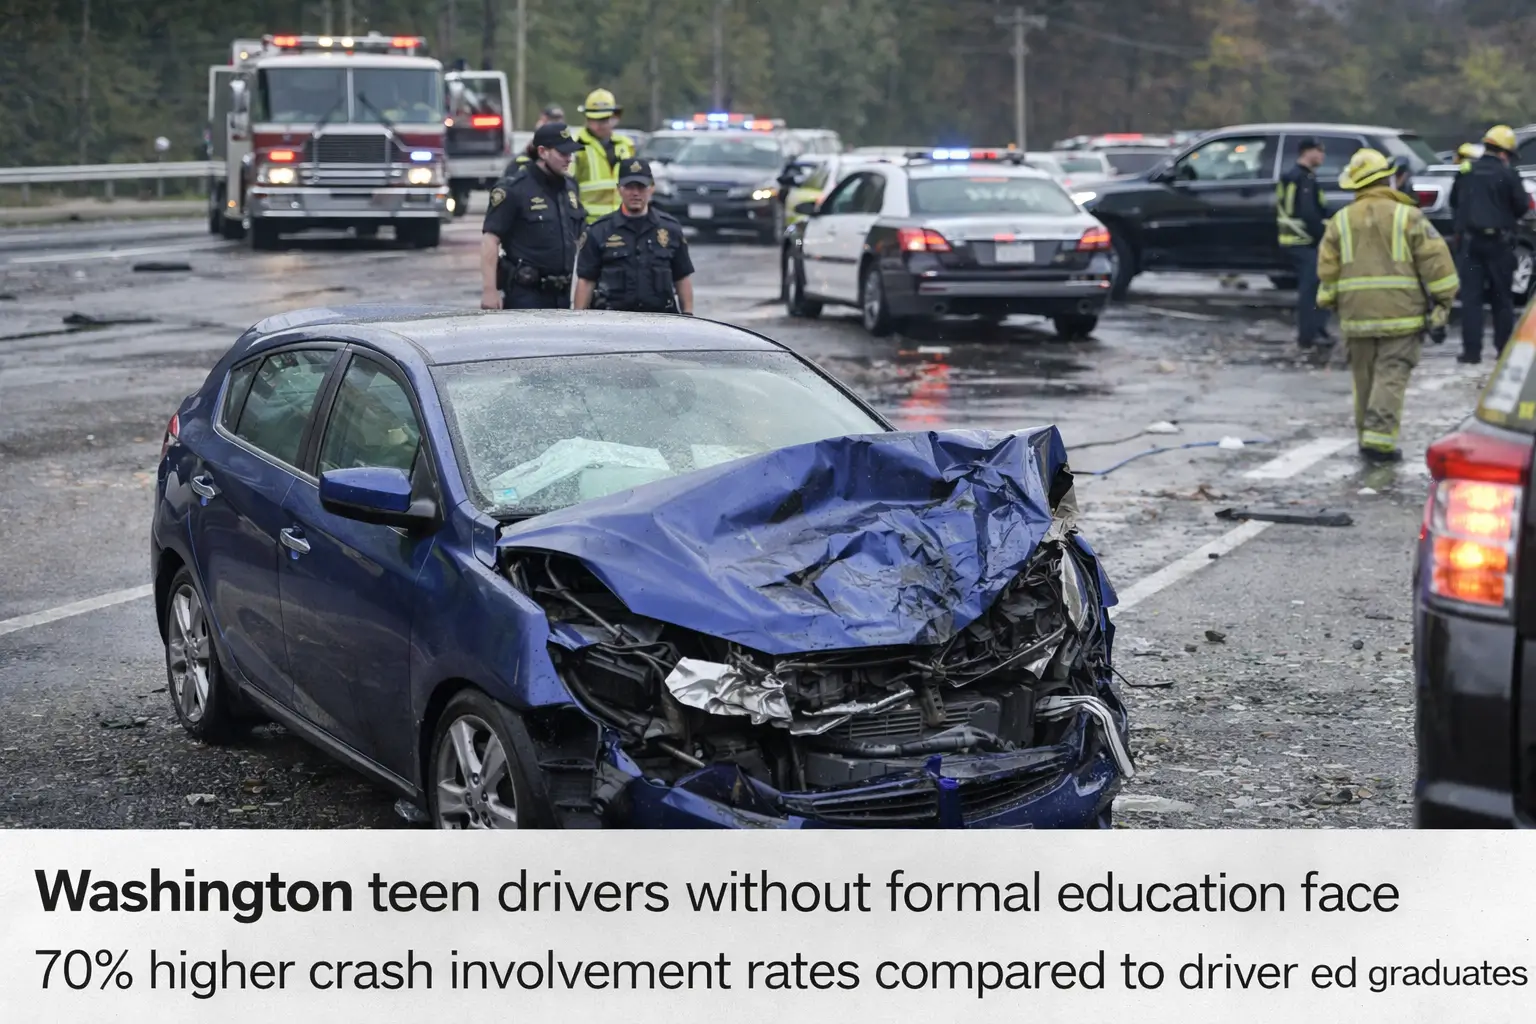
Washington Teen Driver Crash Statistics: Rebuilding After Defunding Crisis
The Cost of Defunding Driver Education Effectiveness
Washington’s story serves as a cautionary tale. After defunding public school programs in 2000-2002, the state experienced dramatic consequences that they’re only now attempting to address through 2025 legislation.
Washington’s Alarming Crash Statistics
- 70% higher rate of crash involvement for ages 18-24 who did NOT complete formal training
- 67% higher crash involvement for ages 18-20 without training
- 60% higher crash involvement for ages 21-24 without training
- Ages 15-24 represent only 10.6% of drivers but are involved in crashes causing 26% of all fatalities and 29% of all serious injuries
Recent Fatal Crash Data
- 2020-2022: 465 crash fatalities involving drivers ages 16-25
- 2023: Washington ranked 9th nationally with 42.4% of teen driver fatalities occurring during “100 Deadliest Days” (Memorial Day-Labor Day)
- 30% of teen drivers (15-20) killed had BAC of .01 g/dL or higher
- 35% of young male drivers in fatal crashes were speeding (17% for females)
Washington’s 2025 Legislative Response: House Bill 1878
Recognizing the crisis created by defunding, Washington is now attempting to rebuild:
- Expands mandatory training to age 21 by 2030
- Creates voucher program for low-income families
- Permits online courses and flexible scheduling
- Only 20 public schools still offer programs (down from nearly all districts pre-2000)
The Access Crisis in Washington
Mark McKechnie, External Relations Director for the Washington Traffic Safety Commission, explained: “For 18 to 25-year-olds who had not taken driver education, they had more than a 60% higher rate of crash involvement. While driver’s ed makes someone less likely to get in a crash, young people do not go because it is either too expensive, or it is not available in their area.”
The privatization created significant equity issues, with Black, Hispanic, and Native young people disproportionately represented in fatal crashes due to financial barriers.
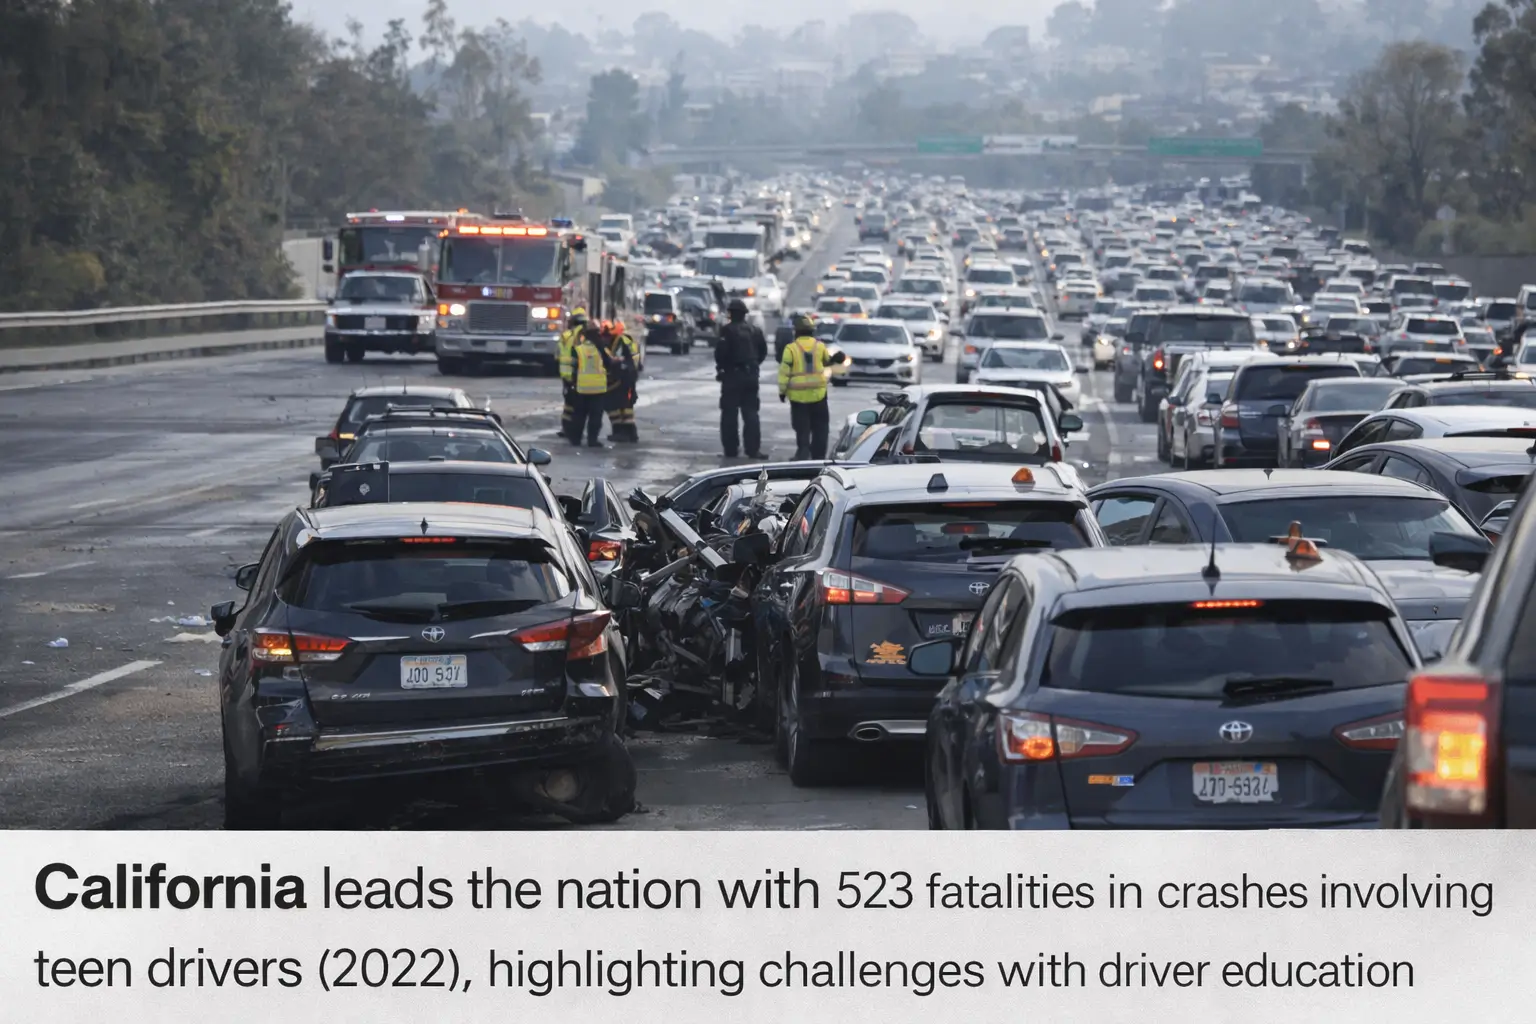
California Teen Driver Crash Statistics: Highest Volume, Mixed Results on Effectiveness
California’s Scale of the Problem
As the nation’s most populous state, California faces the largest absolute numbers of teen crashes, but program effectiveness remains unclear due to lack of standardization.
California Crash Statistics (Ages 15-20)
- 2021: 188 teen drivers killed (2nd highest in nation after Texas with 219)
- 2022: 523 total fatalities in crashes involving teen drivers (highest in nation)
- 2023: 428 teen drivers involved in fatal crashes (10.1% decrease from 2022)
- 10-year average: 326-448 fatal accidents per year involving drivers ages 15-20
- 2024 injuries (Los Angeles alone): 783 accidents with injuries involving teenage drivers ages 15-19
Why California’s Results Differ from Oregon
California DMV studies show much less dramatic results than Oregon’s programs:
- Conventional training (30 hrs classroom, 6 hrs on-road) may reduce crashes by as little as 5% in first 6-12 months
- Some systematic reviews found no compelling evidence that high school programs decreased crashes at individual or community level
- Studies suggested programs sometimes led to earlier licensure, potentially increasing overall crash exposure
- Mix of school-based, private, and home-study options with variable quality
The Critical Difference: Standardization
California’s challenges stem from:
- Lack of centralized quality control (unlike Oregon’s ODOT-TSO approval system)
- Home-study and online options with inconsistent outcomes
- Earlier licensure effects that increase exposure
- No statewide curriculum standard like Oregon’s Playbook R3
California’s GDL Program
California does maintain a graduated licensing program including:
- Driving curfews for provisional license holders
- Passenger restrictions
- Speed limitations
However, research shows GDL effectiveness varies significantly depending on enforcement and how it integrates with training—an area where Oregon excels.
Three-State Comparison: Driver Education Effectiveness Crash Reduction Analysis
Program Effectiveness Hierarchy
| State | Crash Reduction | Key Finding |
|---|---|---|
| Oregon | 91% of crashes involve non-driver-ed teens | 21% lower crash rate, 57% lower violation rate |
| Washington | 60-70% higher crash rates without training | Currently rebuilding defunded programs |
| California | 5% or less crash reduction | Inconsistent quality, lack of standardization |
Fatal Crash Volume (Recent Years)
- California: 523 fatalities involving teen drivers (2022) – highest absolute number
- Washington: 465 fatalities ages 16-25 (2020-2022 combined)
- Oregon: 52 teen drivers in fatal crashes (2012-2016 period, 5-year average)
State Program Structure Comparison
Oregon:
- ✓ Robust ODOT-TSO state-approved program
- ✓ Standardized curriculum (Playbook R3)
- ✓ Rigorous instructor certification (120 hours)
- ✓ Quality oversight and continuing education
- ✓ Centralized tracking through DMV
Washington:
- ✗ Defunded public programs in 2000-2002
- ✗ Privatized system created access barriers
- ✗ Only 20 public schools still offer programs
- ➜ 2025 legislation attempting to rebuild
California:
- ~ Mix of school-based, private, and home-study
- ~ Variable quality across providers
- ~ No centralized approval system like Oregon
- ~ Earlier licensure may increase exposure
Why Oregon Leads: The Competitive Advantage of Standardized Programs
Oregon’s Unique Position in West Coast Driver Safety
Oregon has produced the most dramatic and statistically significant effectiveness data in the West Coast region. Here’s why:
1. Maintained System Integrity While Others Defunded
While Washington eliminated public school funding in 2000-2002 and California allowed programs to fragment into inconsistent quality, Oregon maintained a robust, standardized, state-approved system through ODOT-TSO.
2. Quality Control Through Certification
Oregon’s 120-hour instructor certification requirement, combined with ongoing continuing education and minimum teaching requirements, ensures consistent quality that California and Washington lack.
3. Standardized Curriculum: Playbook R3
The Oregon Risk Prevention Curriculum (Playbook R3) is nationally recognized and provides consistency across all ODOT-approved providers—something neither neighboring state achieved.
4. Integrated GDL System
Oregon’s programs integrate seamlessly with GDL requirements without allowing early licensure to increase exposure—avoiding the trap that undermined California’s outcomes.
5. Centralized Data Tracking
ODOT’s centralized tracking of completion through DMV enables the robust data analysis that produced the compelling 91/9 crash split statistic.
The Numbers Don’t Lie
- Oregon: 91% of crashes involve non-driver-ed teens
- Washington: 70% higher crash rate without training
- California: 5% or less crash reduction
Oregon’s results are 18x more effective than California’s and consistently better than Washington’s compromised system.
What Washington’s 2025 Legislation Reveals
Washington’s House Bill 1878—expanding mandatory training and creating voucher programs—is essentially an attempt to rebuild what Oregon never lost. The legislation explicitly cites the crash rate crisis created by defunding public programs, validating Oregon’s approach of maintaining quality programs.
What This Means for Oregon Families
Choosing an ODOT-Approved Program in Portland
If you’re a Portland-area family researching training, these statistics demonstrate why choosing an ODOT-TSO approved program matters:
Immediate Safety Benefits:
- Your teen is 11x less likely to be involved in a crash compared to non-driver-ed teens (91% vs. 9%)
- 21% lower overall crash rate
- 57% fewer traffic violations
- Dramatically lower fatal crash involvement
Practical Advantages:
- Waived DMV drive test saves time and stress
- Only 50 hours supervised practice required (vs. 100 without)
- Up to 15% insurance discount saves hundreds annually
- Electronic completion submission (no certificate needed as of October 2024)
Long-Term Value:
- Safer driving habits that persist into adulthood
- Lower lifetime crash and violation rates
- Better risk assessment and hazard recognition skills
- Foundation for responsible vehicle operation
What to Look for in an Oregon Provider
- ODOT-TSO Approval: Verify the program appears on Oregon’s official provider list
- Certified Instructors: Confirm instructors have completed the 120-hour certification
- Playbook R3 Curriculum: Ensure they use Oregon’s standardized curriculum
- Behind-the-Wheel Quality: Look for instructor-brake equipped vehicles with additional mirrors
- Track Record: Ask about student pass rates and completion statistics
Financial Assistance Available
Oregon offers subsidies for eligible families:
- Low-income subsidy through State Driver Training Fund (SDTF)
- Economically disadvantaged students qualify for free/reduced tuition
- $6 from each license fee funds support
Research Methodology and Sources
This comprehensive analysis draws from 79 authoritative sources including:
- Oregon Department of Transportation (ODOT) official crash data and studies
- Washington Traffic Safety Commission reports and analysis
- California Department of Motor Vehicles research publications
- National Highway Traffic Safety Administration (NHTSA) statistics
- Insurance Institute for Highway Safety (IIHS) data
- Centers for Disease Control and Prevention (CDC) teen driver research
- Peer-reviewed academic studies on program outcomes
- State DMV databases and traffic crash summaries
Key Studies Referenced
- 2018 ODOT Study: Four-year analysis (2013-2017) showing 91% of Oregon teen crashes involve non-driver-ed teens
- Washington Traffic Safety Commission 2023 Report: Analysis showing 70% higher crash rates for young adults without training
- University of Nebraska-Lincoln Study (2015): 151,800 teen drivers over 8 years showing 24% reduction in fatal/injury crashes
- NHTSA Meta-Analysis of GDL Laws (2015): 16% crash reduction for 16-year-olds, 11% for 17-year-olds
- California DMV Research Series: Multiple studies on teen driver risks and intervention outcomes
Complete source citations: All 79 research sources with direct URLs are documented and available. Data includes ODOT crash analysis reports, Washington state legislative findings, California DMV research publications, NHTSA federal statistics, IIHS fatality analysis, CDC public health data, and peer-reviewed academic journals from PubMed, ScienceDirect, and PMC.
Conclusion: Data-Driven Decision Making for Teen Driver Safety
The statistics are undeniable: Oregon’s ODOT-approved programs deliver results that neighboring states cannot match. While Washington scrambles to rebuild defunded programs and California struggles with inconsistent quality, Oregon families have access to the most effective teen driver safety system on the West Coast.
The Bottom Line
Oregon teens who complete ODOT-approved programs are:
- 11x less likely to crash than non-driver-ed teens
- 21% safer overall
- 57% less likely to receive traffic violations
- Dramatically less likely to be involved in fatal crashes
For Portland families, the choice is clear: ODOT-approved training isn’t just about getting a license—it’s about keeping your teen alive and safe on Oregon roads.
Take Action Today
Don’t gamble with your teen’s safety. Choose an ODOT-TSO approved program and give your teen the comprehensive training that delivers Oregon’s industry-leading safety results.
Contact 1st Learn to Drive today to enroll your teen in Portland’s premier ODOT-approved program. We’re proud to be part of Oregon’s proven system that keeps teens safer than any other state on the West Coast.
Frequently Asked Questions
What percentage of Oregon teen crashes involve drivers without driver education?
According to ODOT’s 2018 study, 91% of crashes involving teen drivers ages 15-20 occurred among teens who had NOT completed formal training. Only 9% of teen crashes involved graduates of ODOT-approved programs.
How much safer are Oregon teens who complete driver education?
Oregon teens who complete ODOT-approved programs have a 21% lower crash rate and 57% lower traffic conviction rate compared to teens without formal training. They are approximately 11 times less likely to be involved in a crash.
How does Oregon compare to Washington and California?
Oregon’s ODOT-approved programs show 91% crash reduction, while Washington reports 60-70% higher crash rates without training, and California shows only 5% or less reduction. Oregon’s standardized approach delivers significantly better results than neighboring states.
Do Oregon teens get insurance discounts?
Yes, Oregon teens who complete ODOT-approved programs can receive up to 15% annual insurance discounts. This can save families hundreds of dollars per year on auto insurance premiums.
What makes Oregon’s programs more effective than other states?
Oregon’s effectiveness comes from ODOT-TSO standardization including rigorous 120-hour instructor certification, nationally-recognized Playbook R3 curriculum, centralized quality control, and integrated GDL system. Washington defunded programs in 2000-2002, and California lacks standardization.